The $1 Million Math: How Many Technicians You Need to Hit $1M in HVAC Revenue
Stop Wasting $50,000: The $1M HVAC Staffing Formula for 15% Net Profit

Hitting $1 million in annual revenue is a milestone for any HVAC business—signaling scalability in a $129.63 billion U.S. market projected to grow at 2.5% CAGR through 2029. But overstaffing drains margins (labor eats 33.8% of costs), while understaffing chokes growth (delays cost $250k/year in lost opportunities amid a 110k tech shortage). The financial pain? Misaligned teams lead to 20-30% profit erosion, per ACCA benchmarks.
This 2025 deep dive—fueled by ServiceTitan, Jobber, BLS, and case studies from 5,000+ firms—breaks it down: Optimal tech counts (3-6 for $1M, varying by model), productivity metrics (revenue/tech $250k-450k average), staffing ratios (1:5 admin:tech), and ROI strategies (e.g., 15% margin boost via training). We'll calculate your needs, avoid pitfalls like 50% turnover, and share templates for scaling to $2M+. If you're bootstrapping or PE-bound, this is your blueprint to staff smart, not hard.
The Staffing Challenge: Why Getting This Wrong Costs HVAC Owners $50k+ Annually

At $1M revenue, you're past solo ops but pre-enterprise chaos—serving 500-1,000 jobs/year across residential/commercial. Techs drive 70-80% of value (via billable hours), but mismatches hurt:
- Overstaffing: Idle techs (under 75% utilization) inflate payroll 20% ($100k+ waste).
- Understaffing: Response times >2 hours tank CSAT 30%, losing 15-20% repeat business ($150k revenue hit).
- Turnover Toll: 30-40% rate costs $5k-10k per tech in rehiring/training.
Industry reality: 60% of HVAC owners lack KPI tracking beyond revenue, per Virtual CFO Solution—leading to "growth pains" like 10-15% margin squeezes. Optimal? 3-6 techs, generating $250k-450k revenue each, with 40-60% gross margins. Let's quantify.
Core Benchmarks: Revenue Per Technician and Staffing Ratios for $1M Revenue
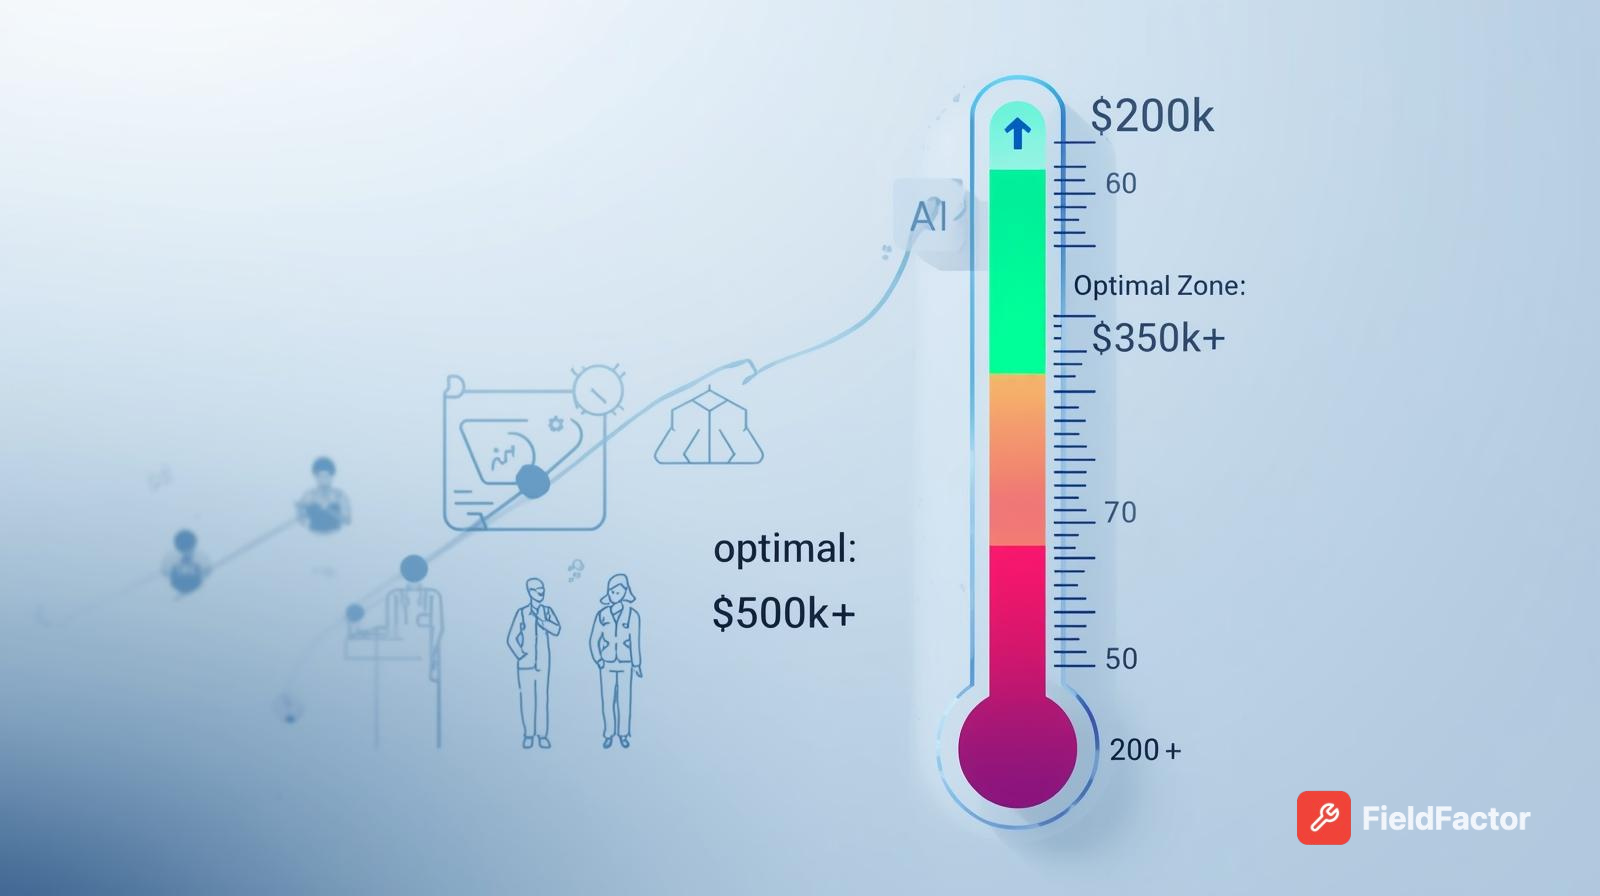
From 2025 data (SBE, ServiceTitan, Workyard), average revenue/tech is $250k-450k, implying 2.2-4 techs for $1M—but factor efficiency.
Revenue Per Technician Benchmarks
| Experience Level | Avg. Annual Revenue/Tech | Jobs/Year | Avg. Ticket Size | Notes/Source |
|---|---|---|---|---|
| Entry (0-2 yrs) | $200k-300k | 800-1,200 | $200-300 | Focus repairs; 20% wage-to-revenue ratio. |
| Mid (2-5 yrs) | $300k-450k | 600-900 | $400-600 | Mix service/installs; NATE cert +15%. |
| Senior (5+ yrs) | $450k-1M+ | 400-600 | $700-1,500 | Replacements/upsells; top 10% hit $2M. |
Assumes 1,800-2,000 billable hours/year; 40% recurring contracts.
Staffing Ratios for $1M Firms
| Role Ratio | Benchmark | $1M Implication | Optimization Tip |
|---|---|---|---|
| Techs:Revenue | $250k-450k/tech | 2.2-4 techs | Track via ServiceTitan; aim 75% utilization. |
| Admin:Tech | 1:5 (new admin) to 1:7 (experienced) | 0.5-0.8 admins | 1 admin supports 5 techs; overstaff erodes 10% margins. |
| CSRs:Tech | 1:3-5 | 1 CSR | Handles 50-70 calls/day; AI offloads 20%. |
| Total Staff | 3-6 techs + 1-2 support | 4-8 total | Case: 6 staff for $1M+ (Impetus Plumbing). |
Data: SBE, ServiceTitan 2025; Ratios ensure 40-60% gross margins.
For $1M: 3-4 techs in service-heavy models (residential, $300k/tech); 5-6 for installs (commercial, $200k/tech). Adjust: 500 members = $1M recurring (Sera rule).
Calculating Your Exact Tech Needs: A Step-by-Step Formula

Use this 2025 formula: Techs Needed = Total Revenue / (Avg. Revenue/Tech × Utilization Rate).
Inputs for $1M
- Target Revenue: $1,000,000
- Avg. Revenue/Tech: $350,000 (midpoint benchmark)
- Utilization: 75% (billable hours; industry avg. 70-80%)
- Calculation: $1M / ($350k × 0.75) = $1M / $262.5k = 3.8 techs (round to 4).
| Scenario | Revenue/Tech | Utilization | Techs Needed | Annual Cost (at $60k/tech) |
|---|---|---|---|---|
| Service-Focused | $400k | 80% | 3.1 (round 3) | $180k |
| Install-Heavy | $250k | 70% | 5.7 (round 6) | $360k |
| Balanced (Optimal) | $350k | 75% | 3.8 (round 4) | $240k |
Costs include salary + 20% benefits; Assumes 15% net margins post-labor.
Pro Tip: Factor seasonality—add 1 seasonal tech for 50% summer spikes.
Factors Influencing Tech Counts: Revenue Model, Efficiency, and Market Realities
Your $1M mix dictates staffing—service scales leaner than installs.
1. Business Model Breakdown
- Residential Service (70% revenue): 3-4 techs ($300k/tech); High recurring (40% contracts).
- Commercial Installs (30%): 5-6 techs ($200k/tech); Larger jobs, longer cycles.
- Hybrid: 4 techs; 500 members ensure steady $1M (Sera benchmark).
2. Technician Productivity Drivers
- Billable Hours: 1,800-2,000/year (75% utilization); Track via Jobber.
- Ticket Size: $400-600 avg.; Upsells +25% via training.
- Certs/Experience: NATE +15% revenue/tech.
3. Market and Location Impacts
- High-Demand (TX/CA): 3 techs suffice ($400k/tech); Shortage boosts productivity.
- Competitive Urban: 5 techs for faster response (<2hrs).
- Recession-Resilient: 40% recurring = 1 fewer tech needed.
4. Overhead and Support Ratios
- Admin: 1:5-7 techs; 1 CSR:3-5 techs.
- Vehicles/Tools: $15k-20k/tech annually.
| Factor | Low Impact (3 Techs) | High Impact (6 Techs) |
|---|---|---|
| Model | 70% service | 50% installs |
| Utilization | 80% | 60% |
| Location | Rural/high-demand | Urban/competitive |
| Recurring % | 50% | 20% |
Key Metrics for HVAC Staffing Success: Track These 8 for 15-20% Margin Gains
Beyond counts, monitor these—top firms hit 12% net via KPIs.
| Metric | $1M Benchmark | Why Track? | Target |
|---|---|---|---|
| Revenue/Tech | $250k-450k | Core productivity; < $200k signals inefficiency. | $350k avg. |
| Utilization Rate | 75-80% | Billable vs. total hours; <70% = overstaff. | 80% via scheduling. |
| Gross Margin | 40-60% | Post-labor/materials; Ties to tech efficiency. | 50%+. |
| Jobs/Tech/Year | 600-900 | Volume indicator; Surges with training. | 750. |
| Turnover Rate | <20% | $5k-10k cost/tech; High = revenue dips 10%. | 15% via incentives. |
| Response Time | <2 hours | CSAT driver; Delays lose 20% leads. | 90 min. |
| CAC (Customer Acquisition Cost) | $200-400 | Marketing ROI; Lowers with referrals. | Under $300. |
| LTV (Lifetime Value) | $5k-10k/customer | Recurring impact; Boosts via contracts. | $7k. |
Tools: ServiceTitan for dashboards; Weekly reviews lift 15% efficiency.
Strategies to Optimize Staffing: Scale to $1M with 3-4 Techs and 20% Margins

Hit targets with these 7 tactics—proven in 2025 cases.
- Productivity Training: NATE certs + sales scripting = +15-25% revenue/tech; ROI in 3 months.
- Tech Utilization Boost: Route optimization (Samsara) + dispatching software = 80% billable; Saves 1 tech equivalent.
- Recurring Revenue Focus: 500 members/$1M (Sera); Stabilizes, reducing seasonal hires 20%.
- Hiring Smart: Entry-level ($40k) for volume; Seniors ($77k) for high-ticket; 1:5 admin ratio.
- Outsourcing Peaks: Virtual dispatch for surges; Cuts full-time needs 10-15%.
- Incentives for Retention: Profit-sharing (5% pool) = <20% turnover; Saves $20k/year.
- KPI Dashboards: Track weekly; Adjust staffing quarterly for 12% margins.
Case Studies: Real $1M HVAC Firms and Their Tech Stacks
- Impetus Plumbing & Heating (TX): $1M+ with 6 total staff (4-5 techs implied); Focused training + software = 21% revenue growth.
- SBE Client (National): 3 techs at $350k each hit $1M; Wage-revenue 20% cap ensured 15% net.
- Grasshopper Heating (Midwest): 5 techs for $1.2M; Installs averaged 8-14 hrs/job, utilization 78%.
Common Pitfalls: Why 60% of $1M HVAC Firms Overstaff (And Fixes)
- Ignoring Utilization: 70% billable? Hire more—Fix: GPS tracking + training.
- Seasonal Blind Spots: Summer overload—Fix: 1 temp tech/quarter.
- No Ratios: Admin >1:5—Fix: Automate scheduling (Jobber).
- Turnover Trap: 40% rate—Fix: Cert reimbursements + bonuses.
Future-Proofing: Staffing Trends for $2M+ in 2026
- AI Dispatch: Offloads 20% admin; Enables 1:7 ratios.
- Green Certs: Heat pump demand +22% programs; +15% revenue/tech.
- Hybrid Models: 40% recurring = 1 fewer tech; $1M with 3 optimized.
Conclusion: Staff Right for $1M—3-4 Techs, $350k Each, 15% Margins
For $1M, aim 3-4 techs at $250k-450k revenue each—total staff 4-6 with 1:5 ratios. Track utilization weekly, train quarterly, and watch margins hit 12-15%. Download our free staffing calculator below—what's your current revenue/tech? Comment to benchmark.


